1955 D'Angelico New Yorker
INTRO
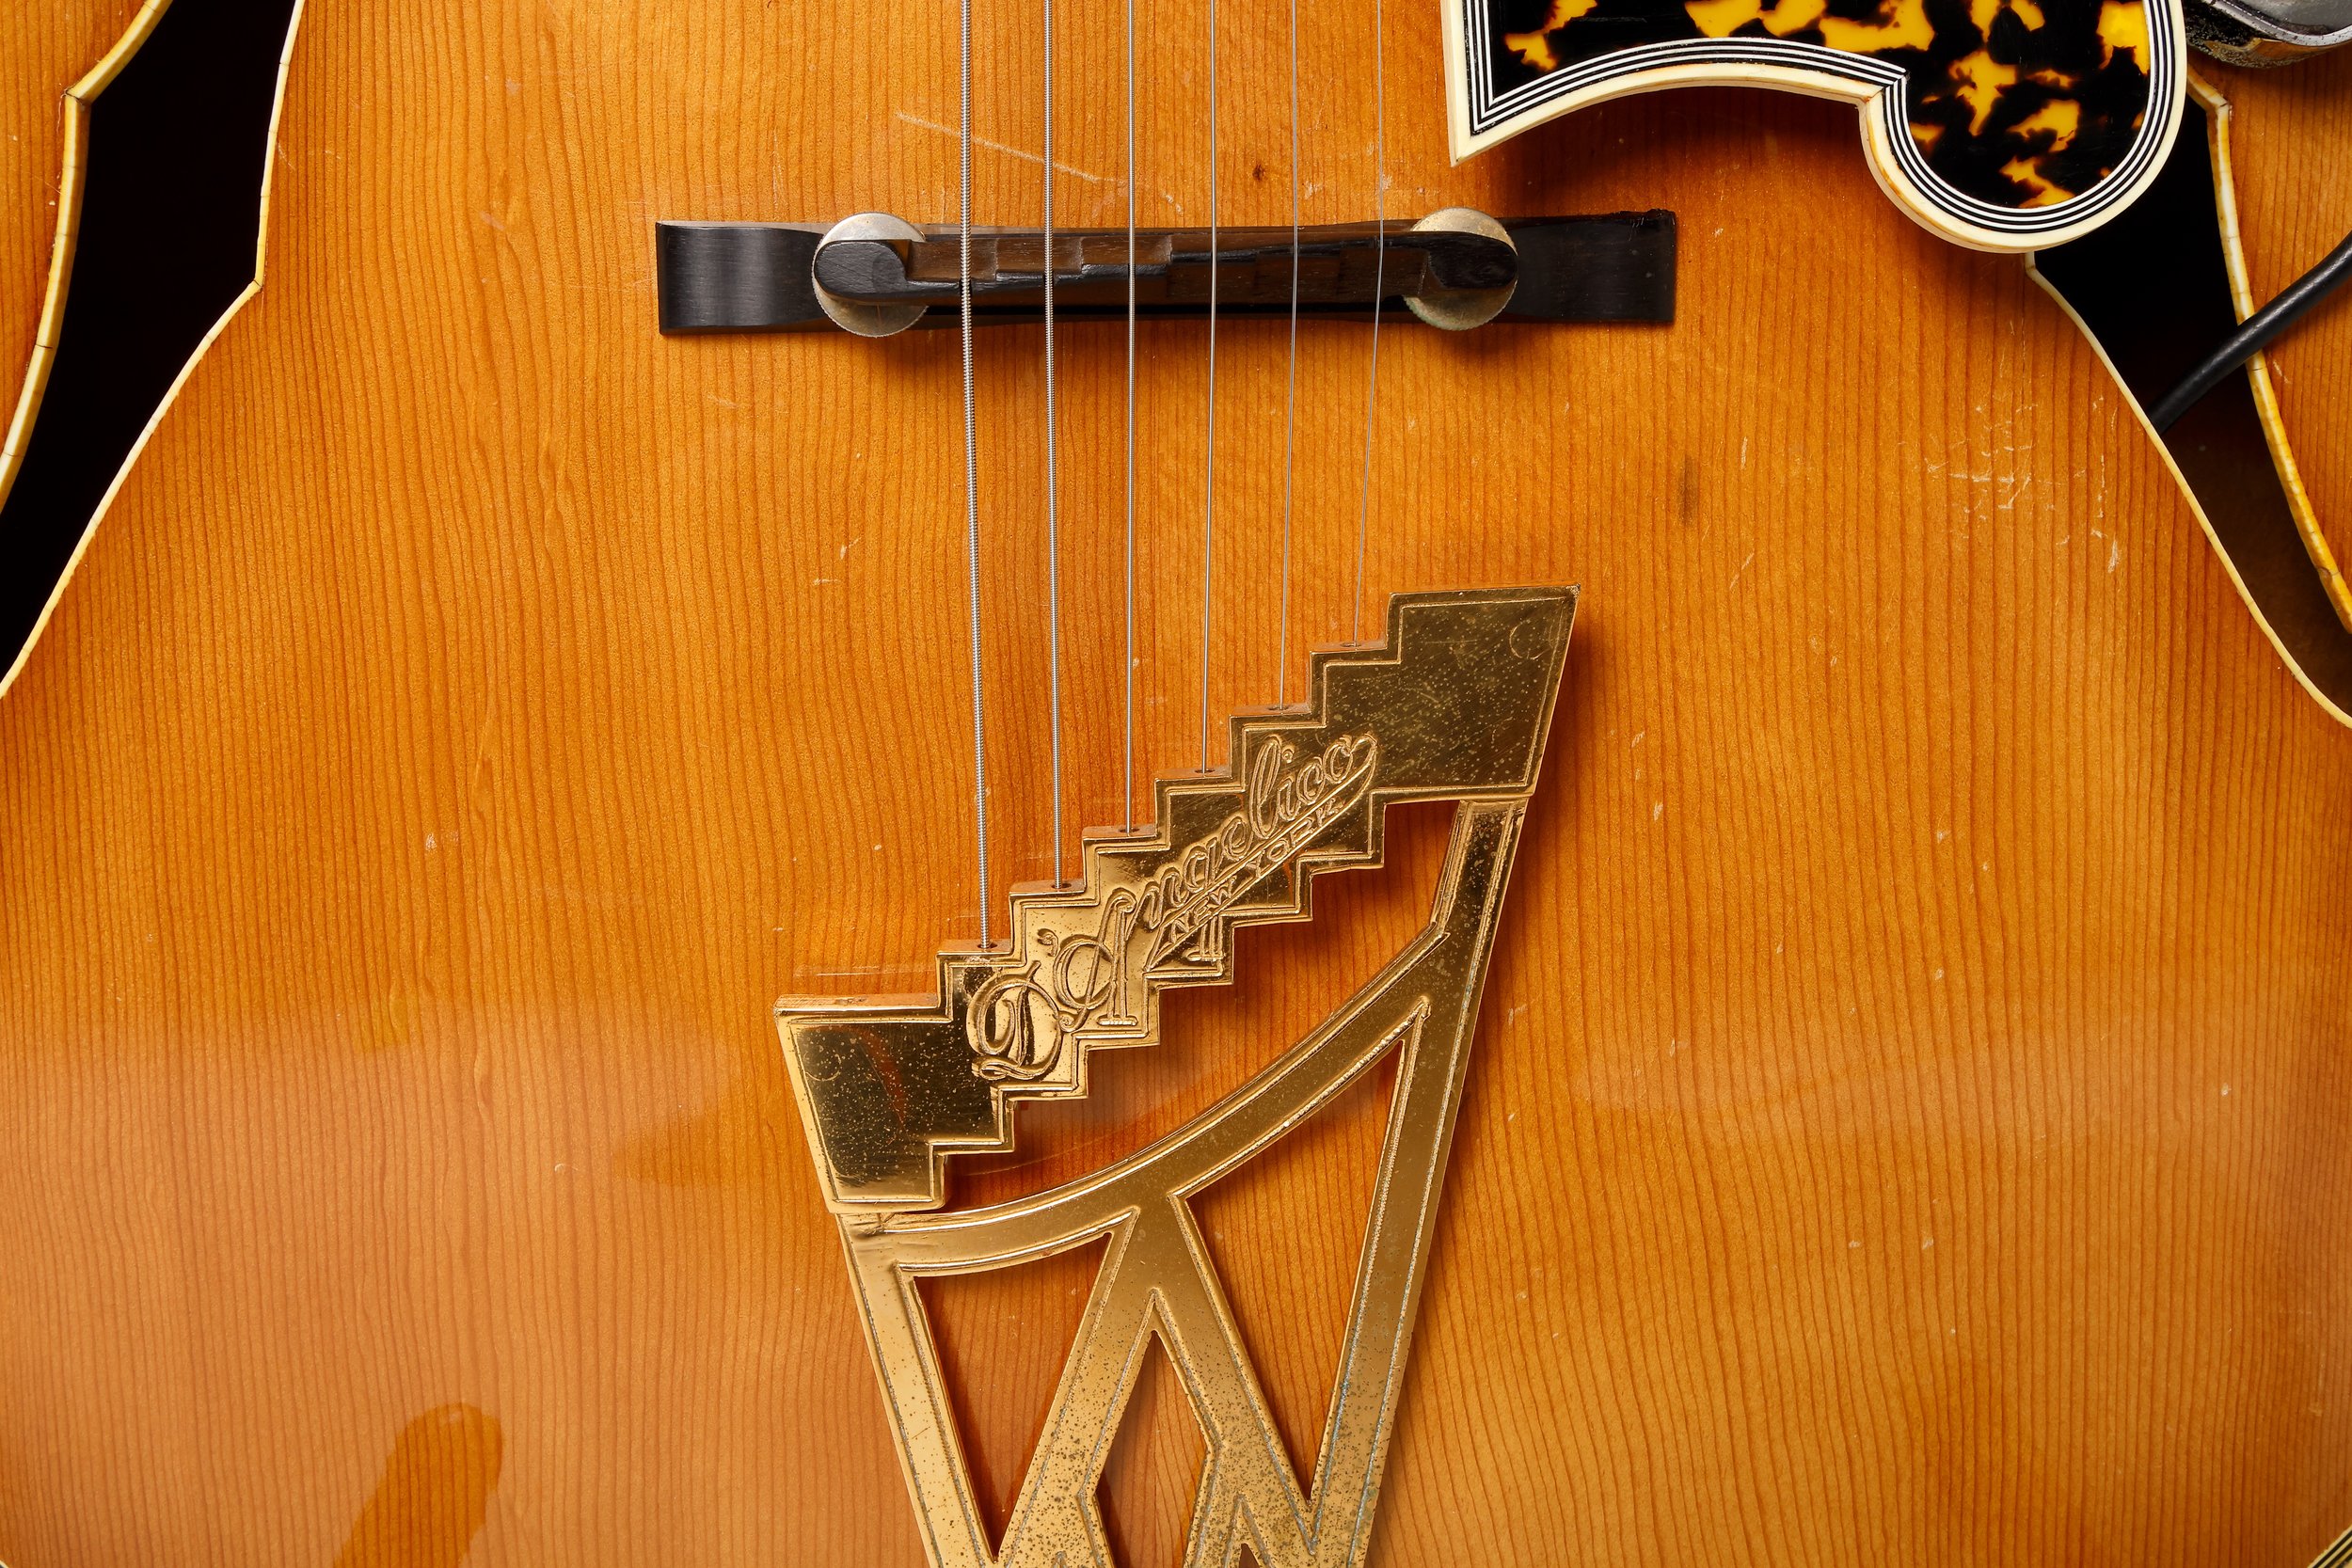
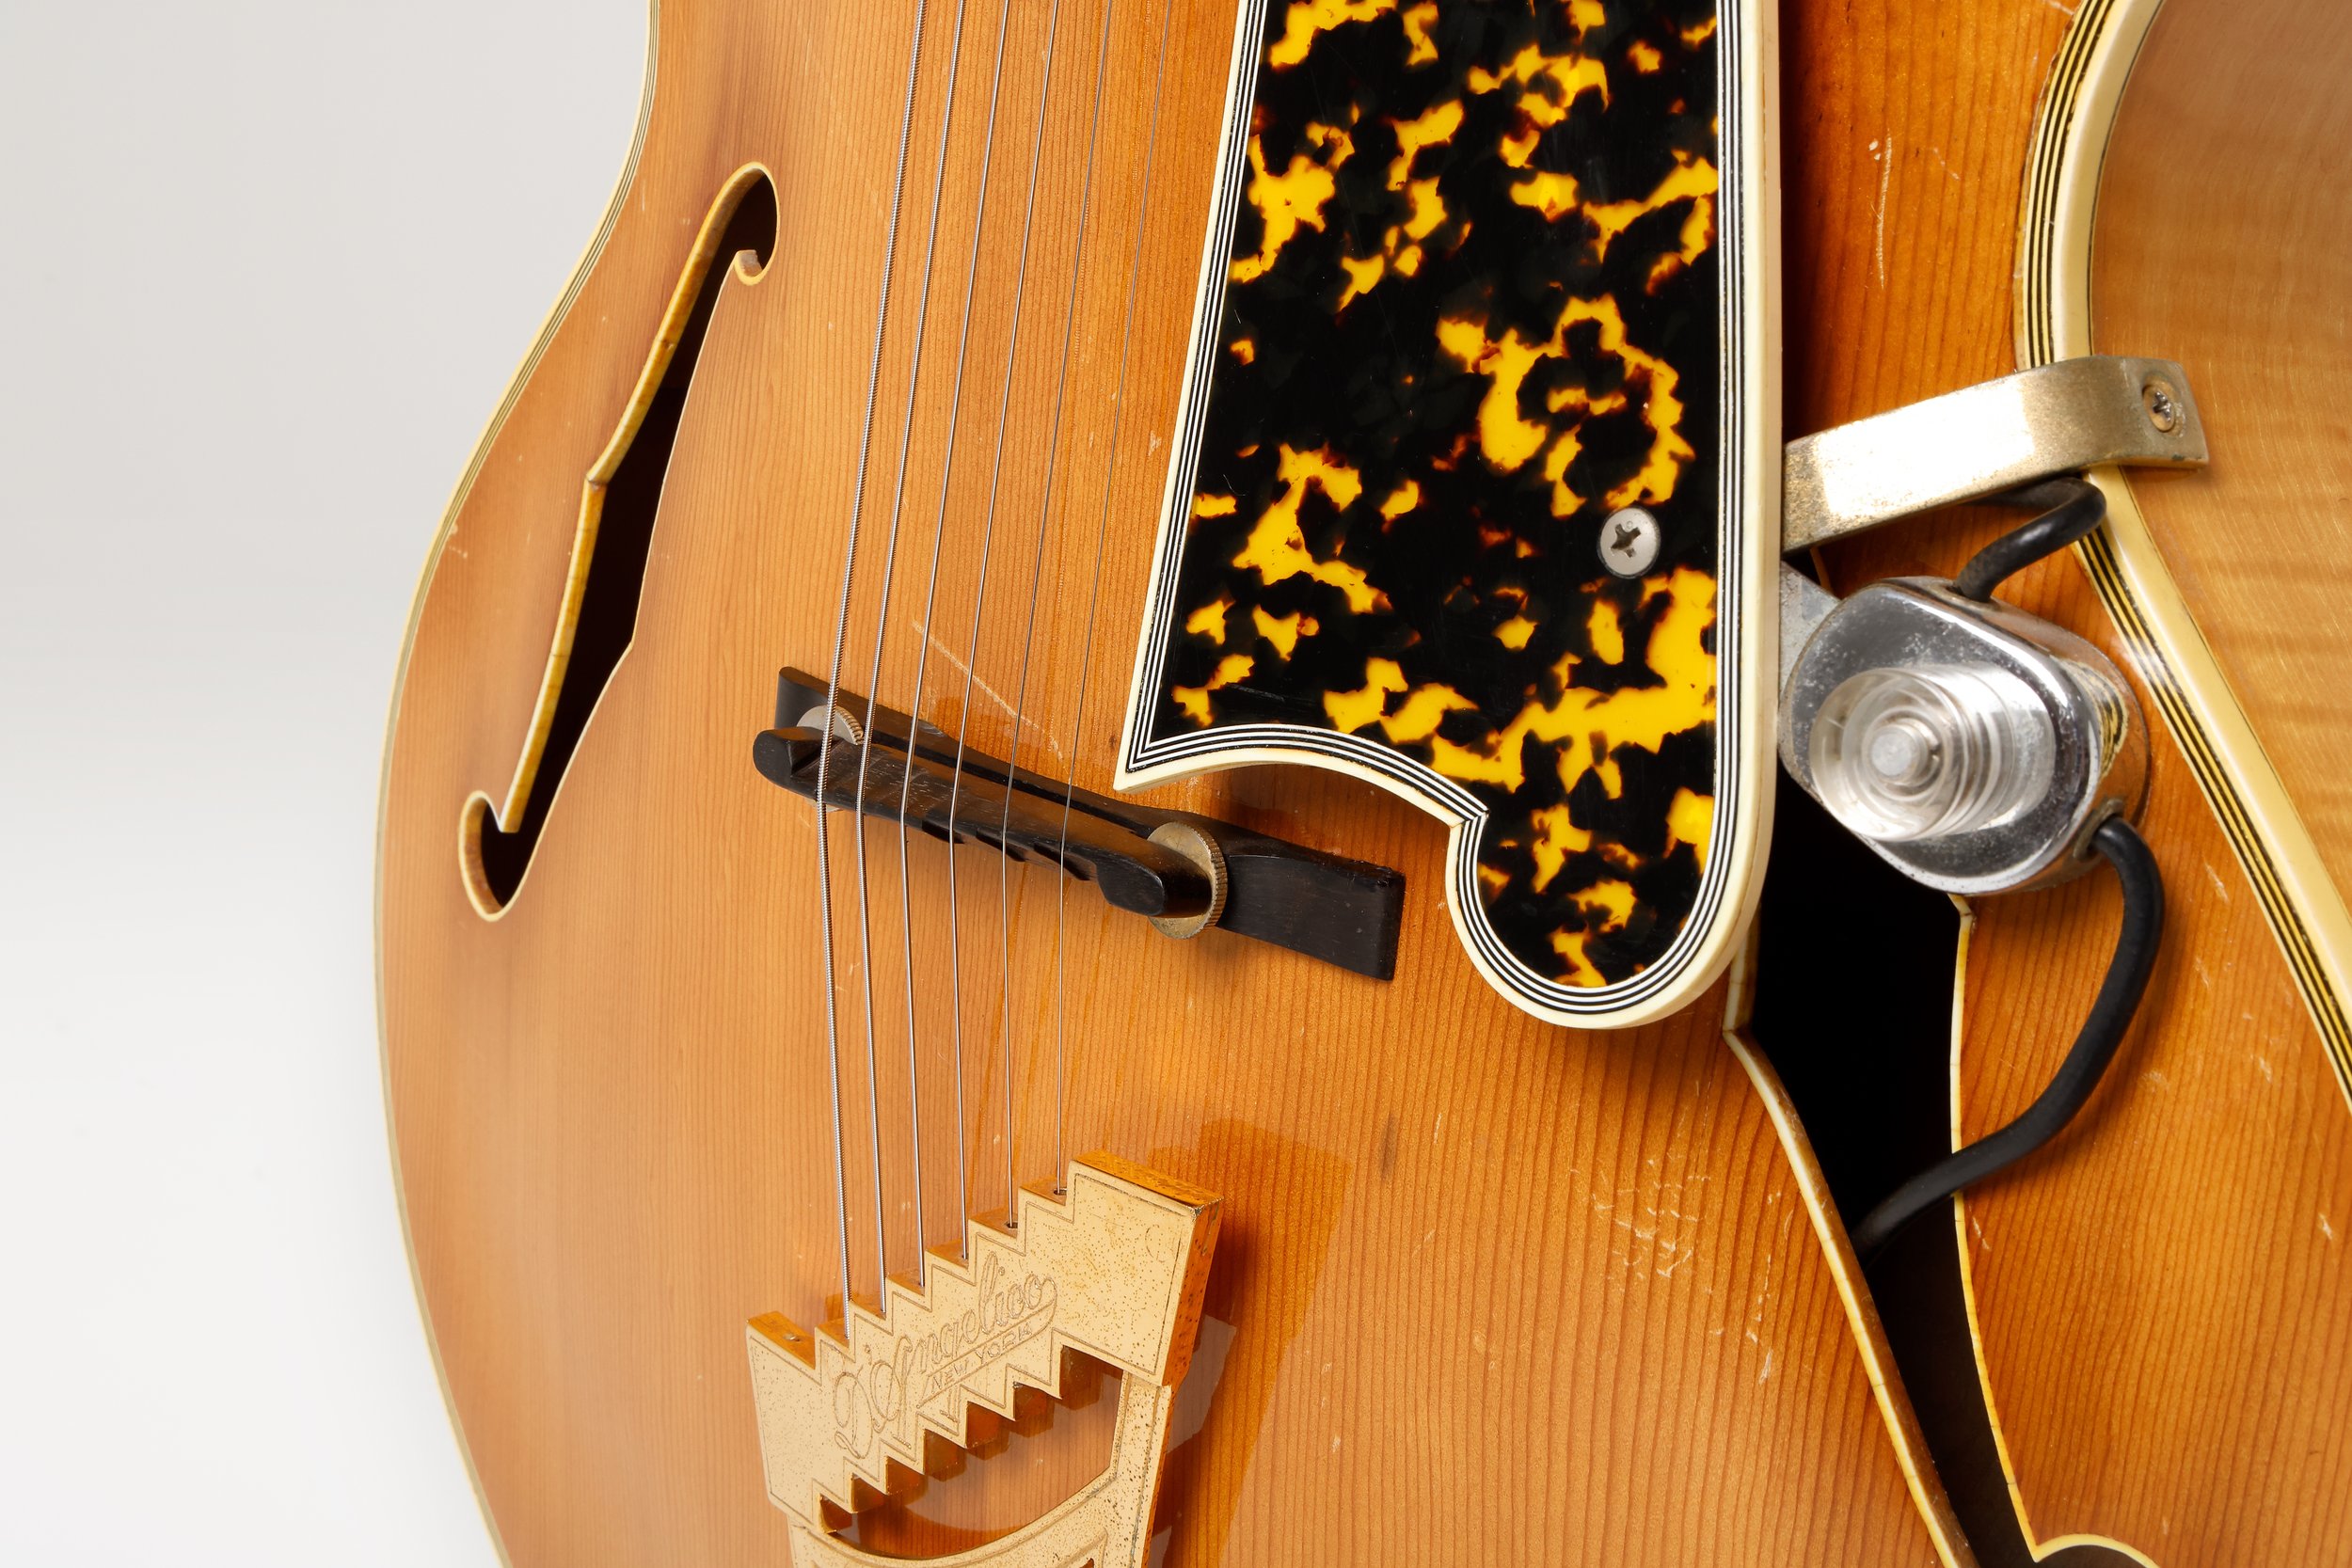
The New Yorker was John D’Angelico’s most opulent design. This full-bodied 1955 New Yorker has a dark, warm voice. The X-bracing enhances an even, less punchy response than parallel braced jazz boxes—ideal for the accompanying DeArmond pickup.
For more on the history of D'Angelico archtops please see: The Masters' Bench – National Music Museum (national-music-museum.myshopify.com); and Paul Schmidt - Acquired of the Angels (3rd Edition) - DjangoBooks.com


PROFILE
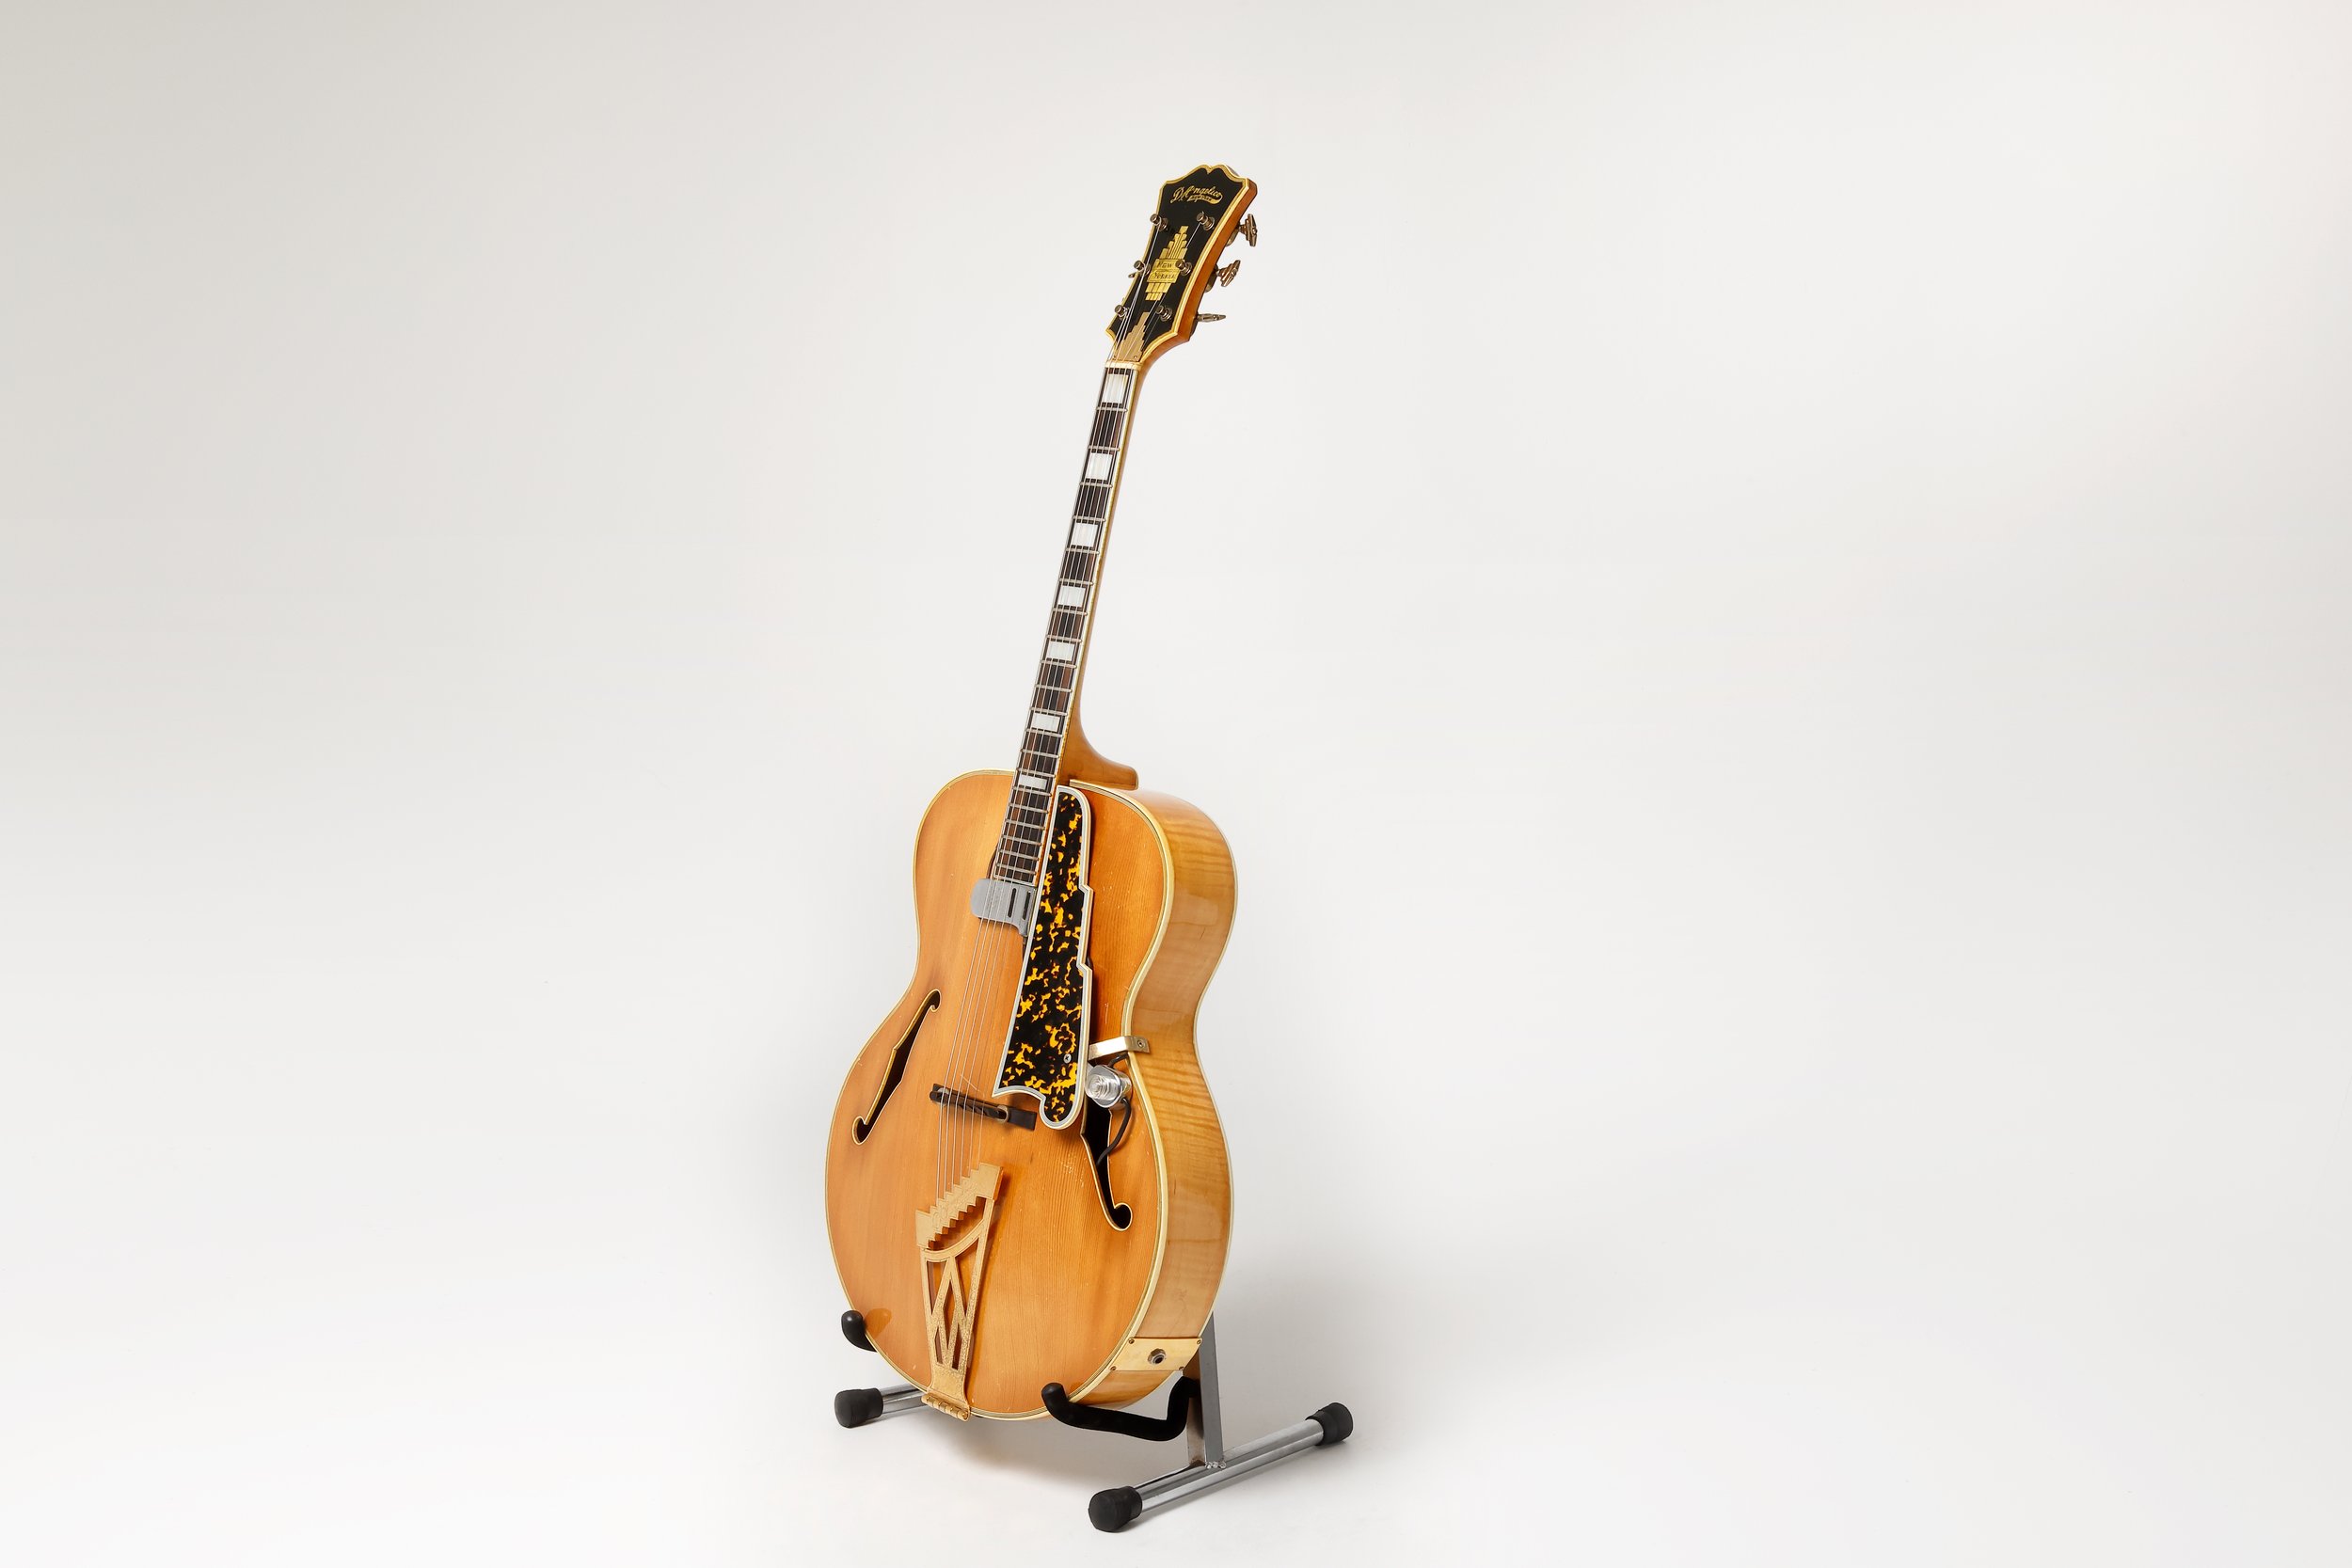
1955 D'Angelico New Yorker
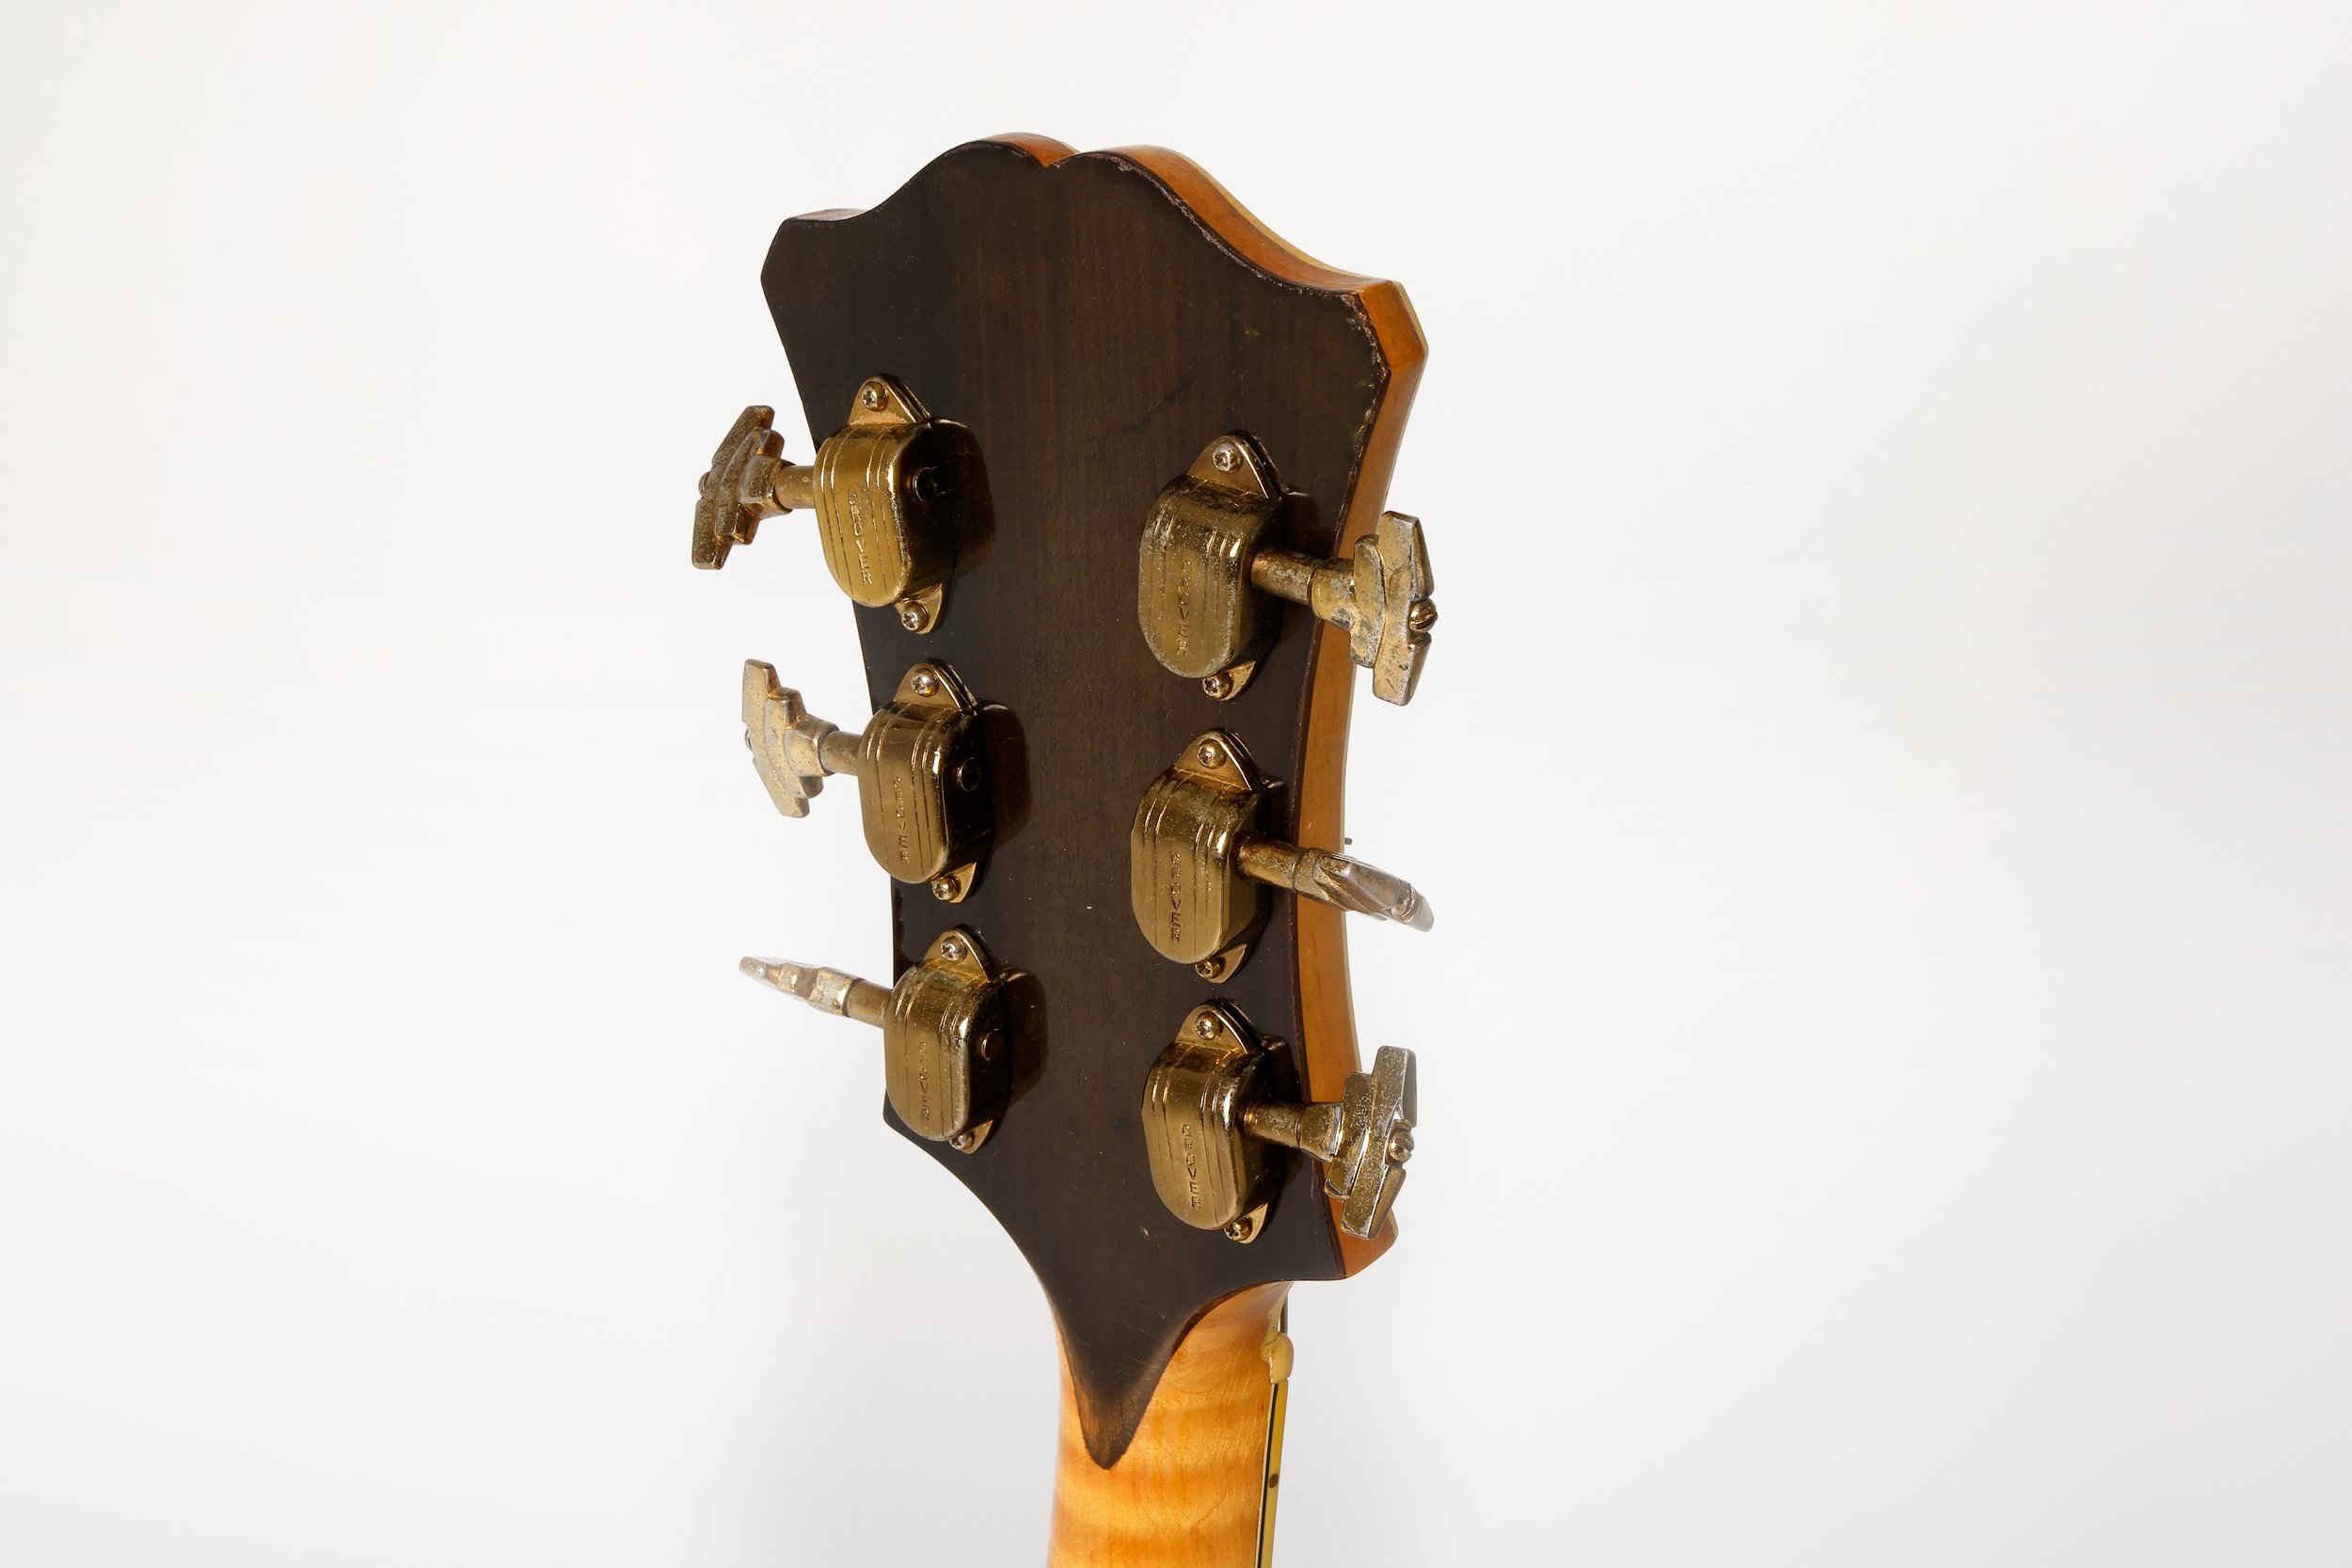
Serial Number: 1998
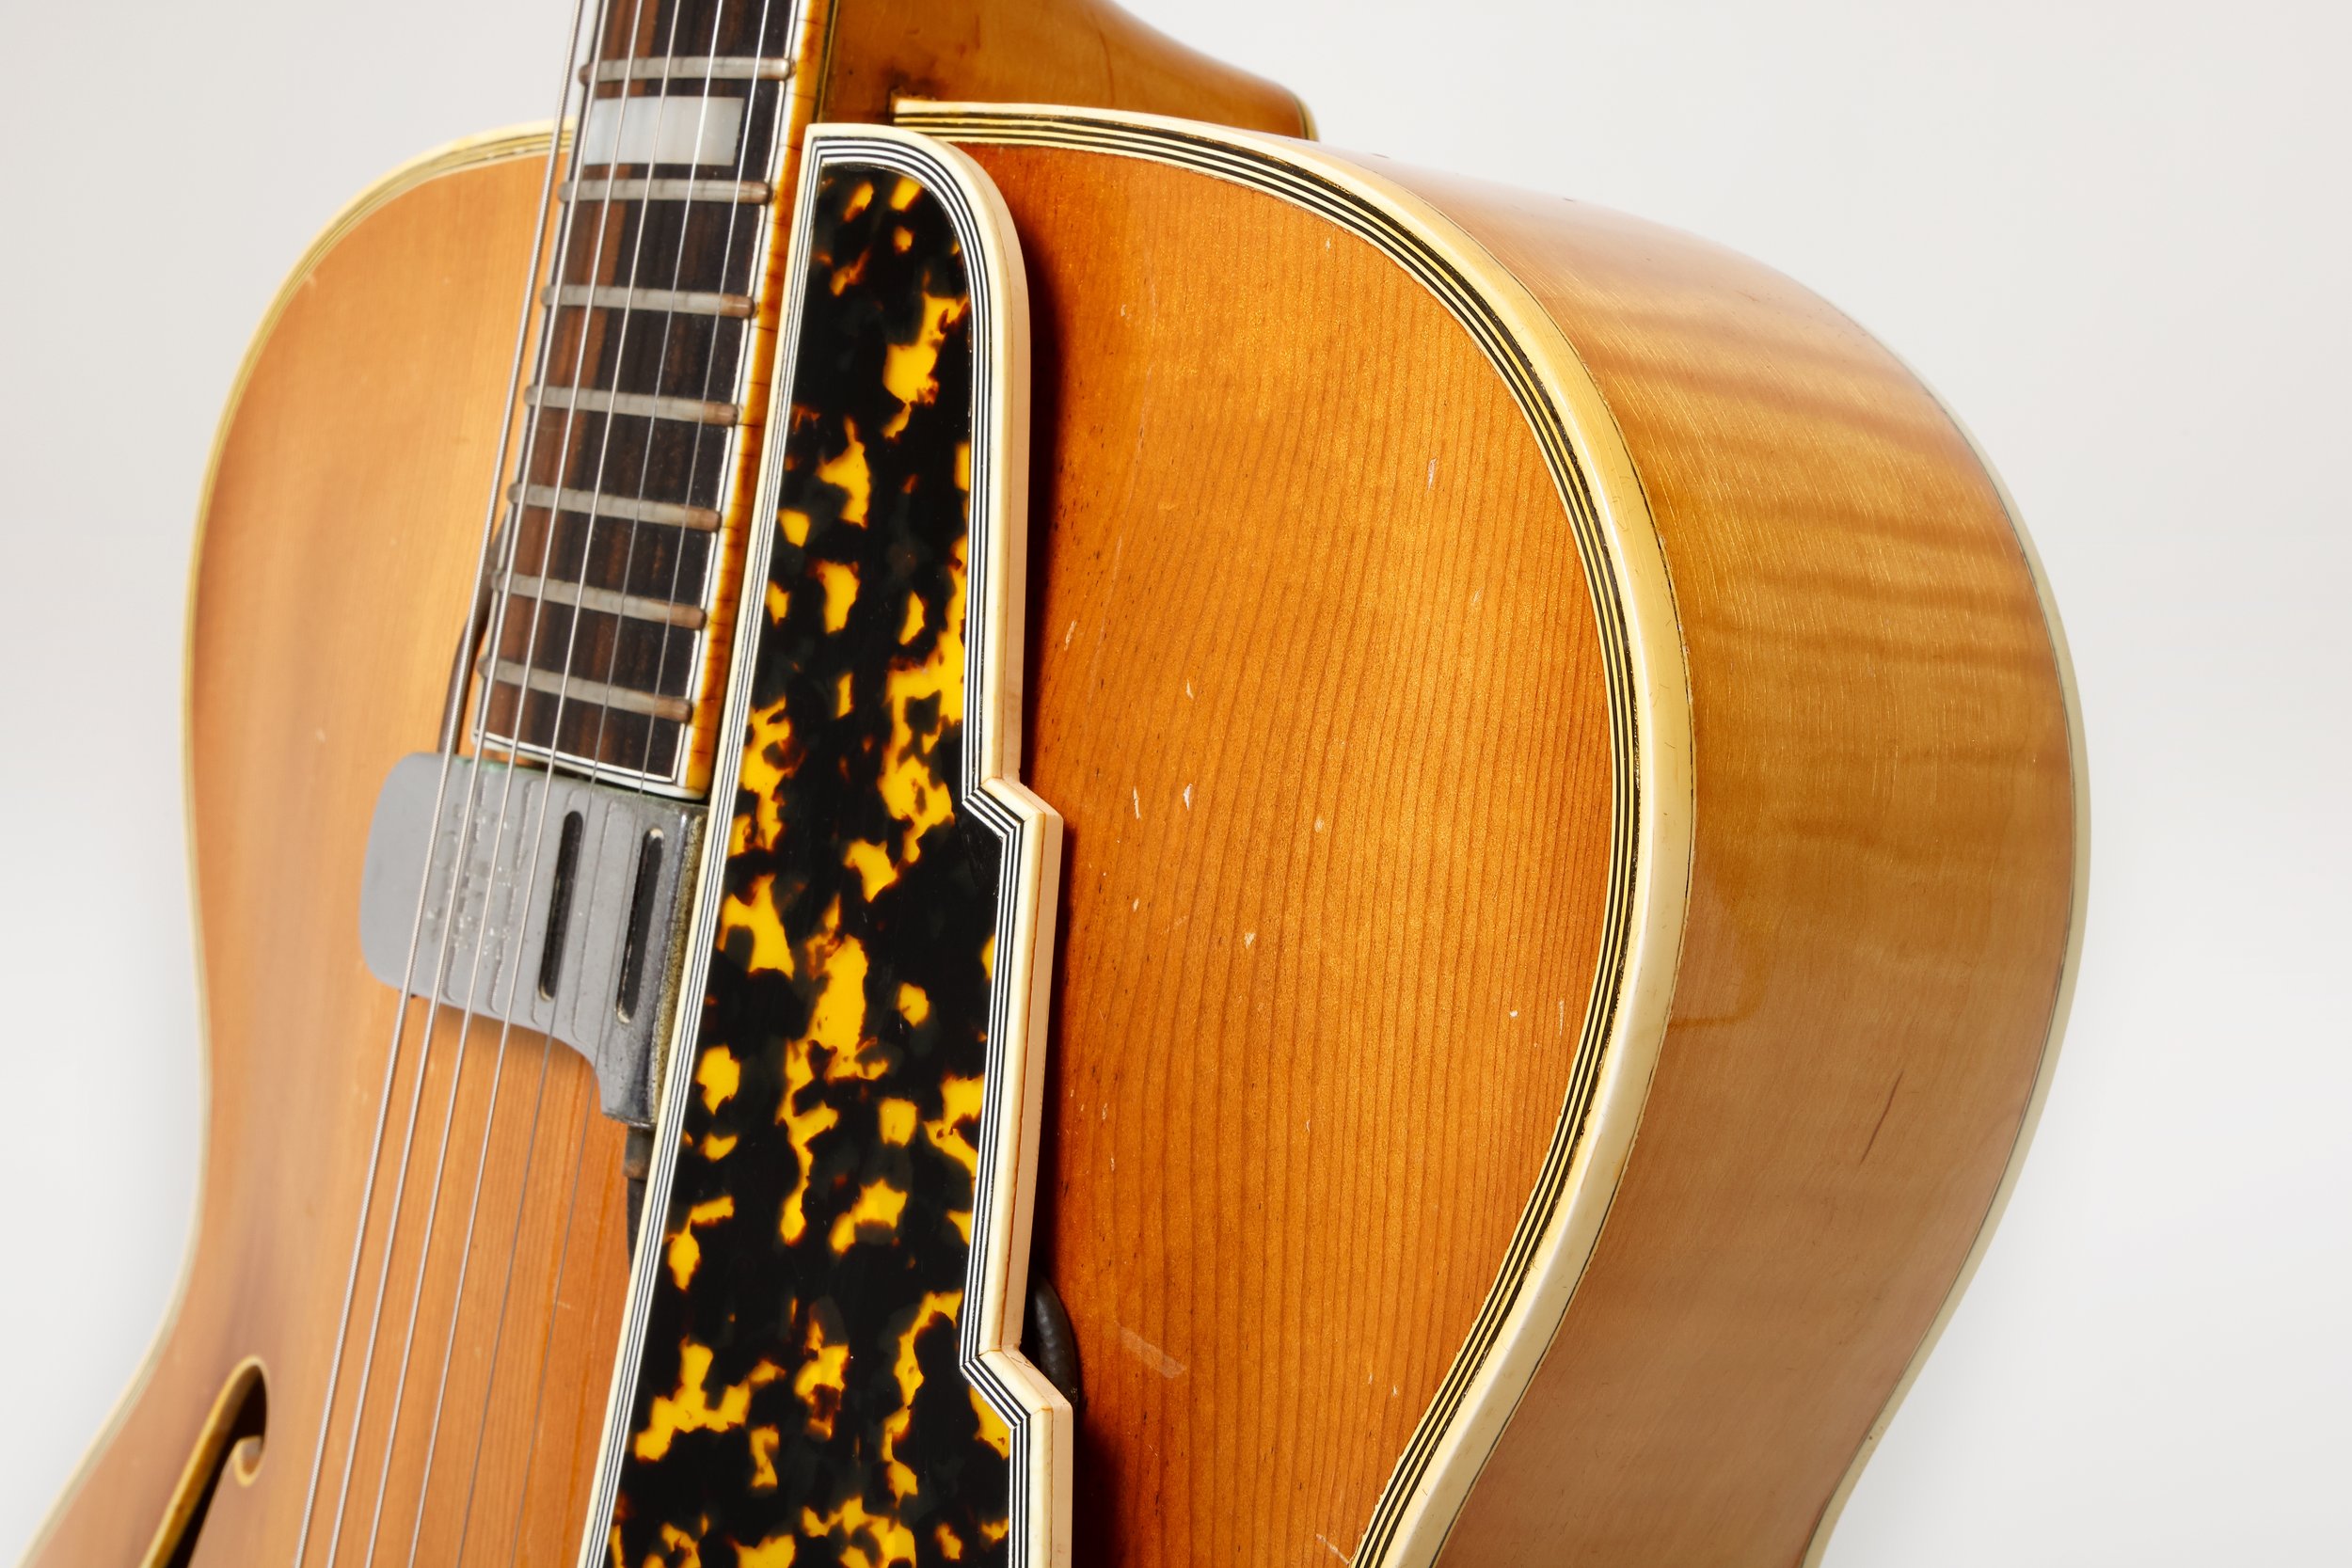
Quarter Sawn Spruce Top
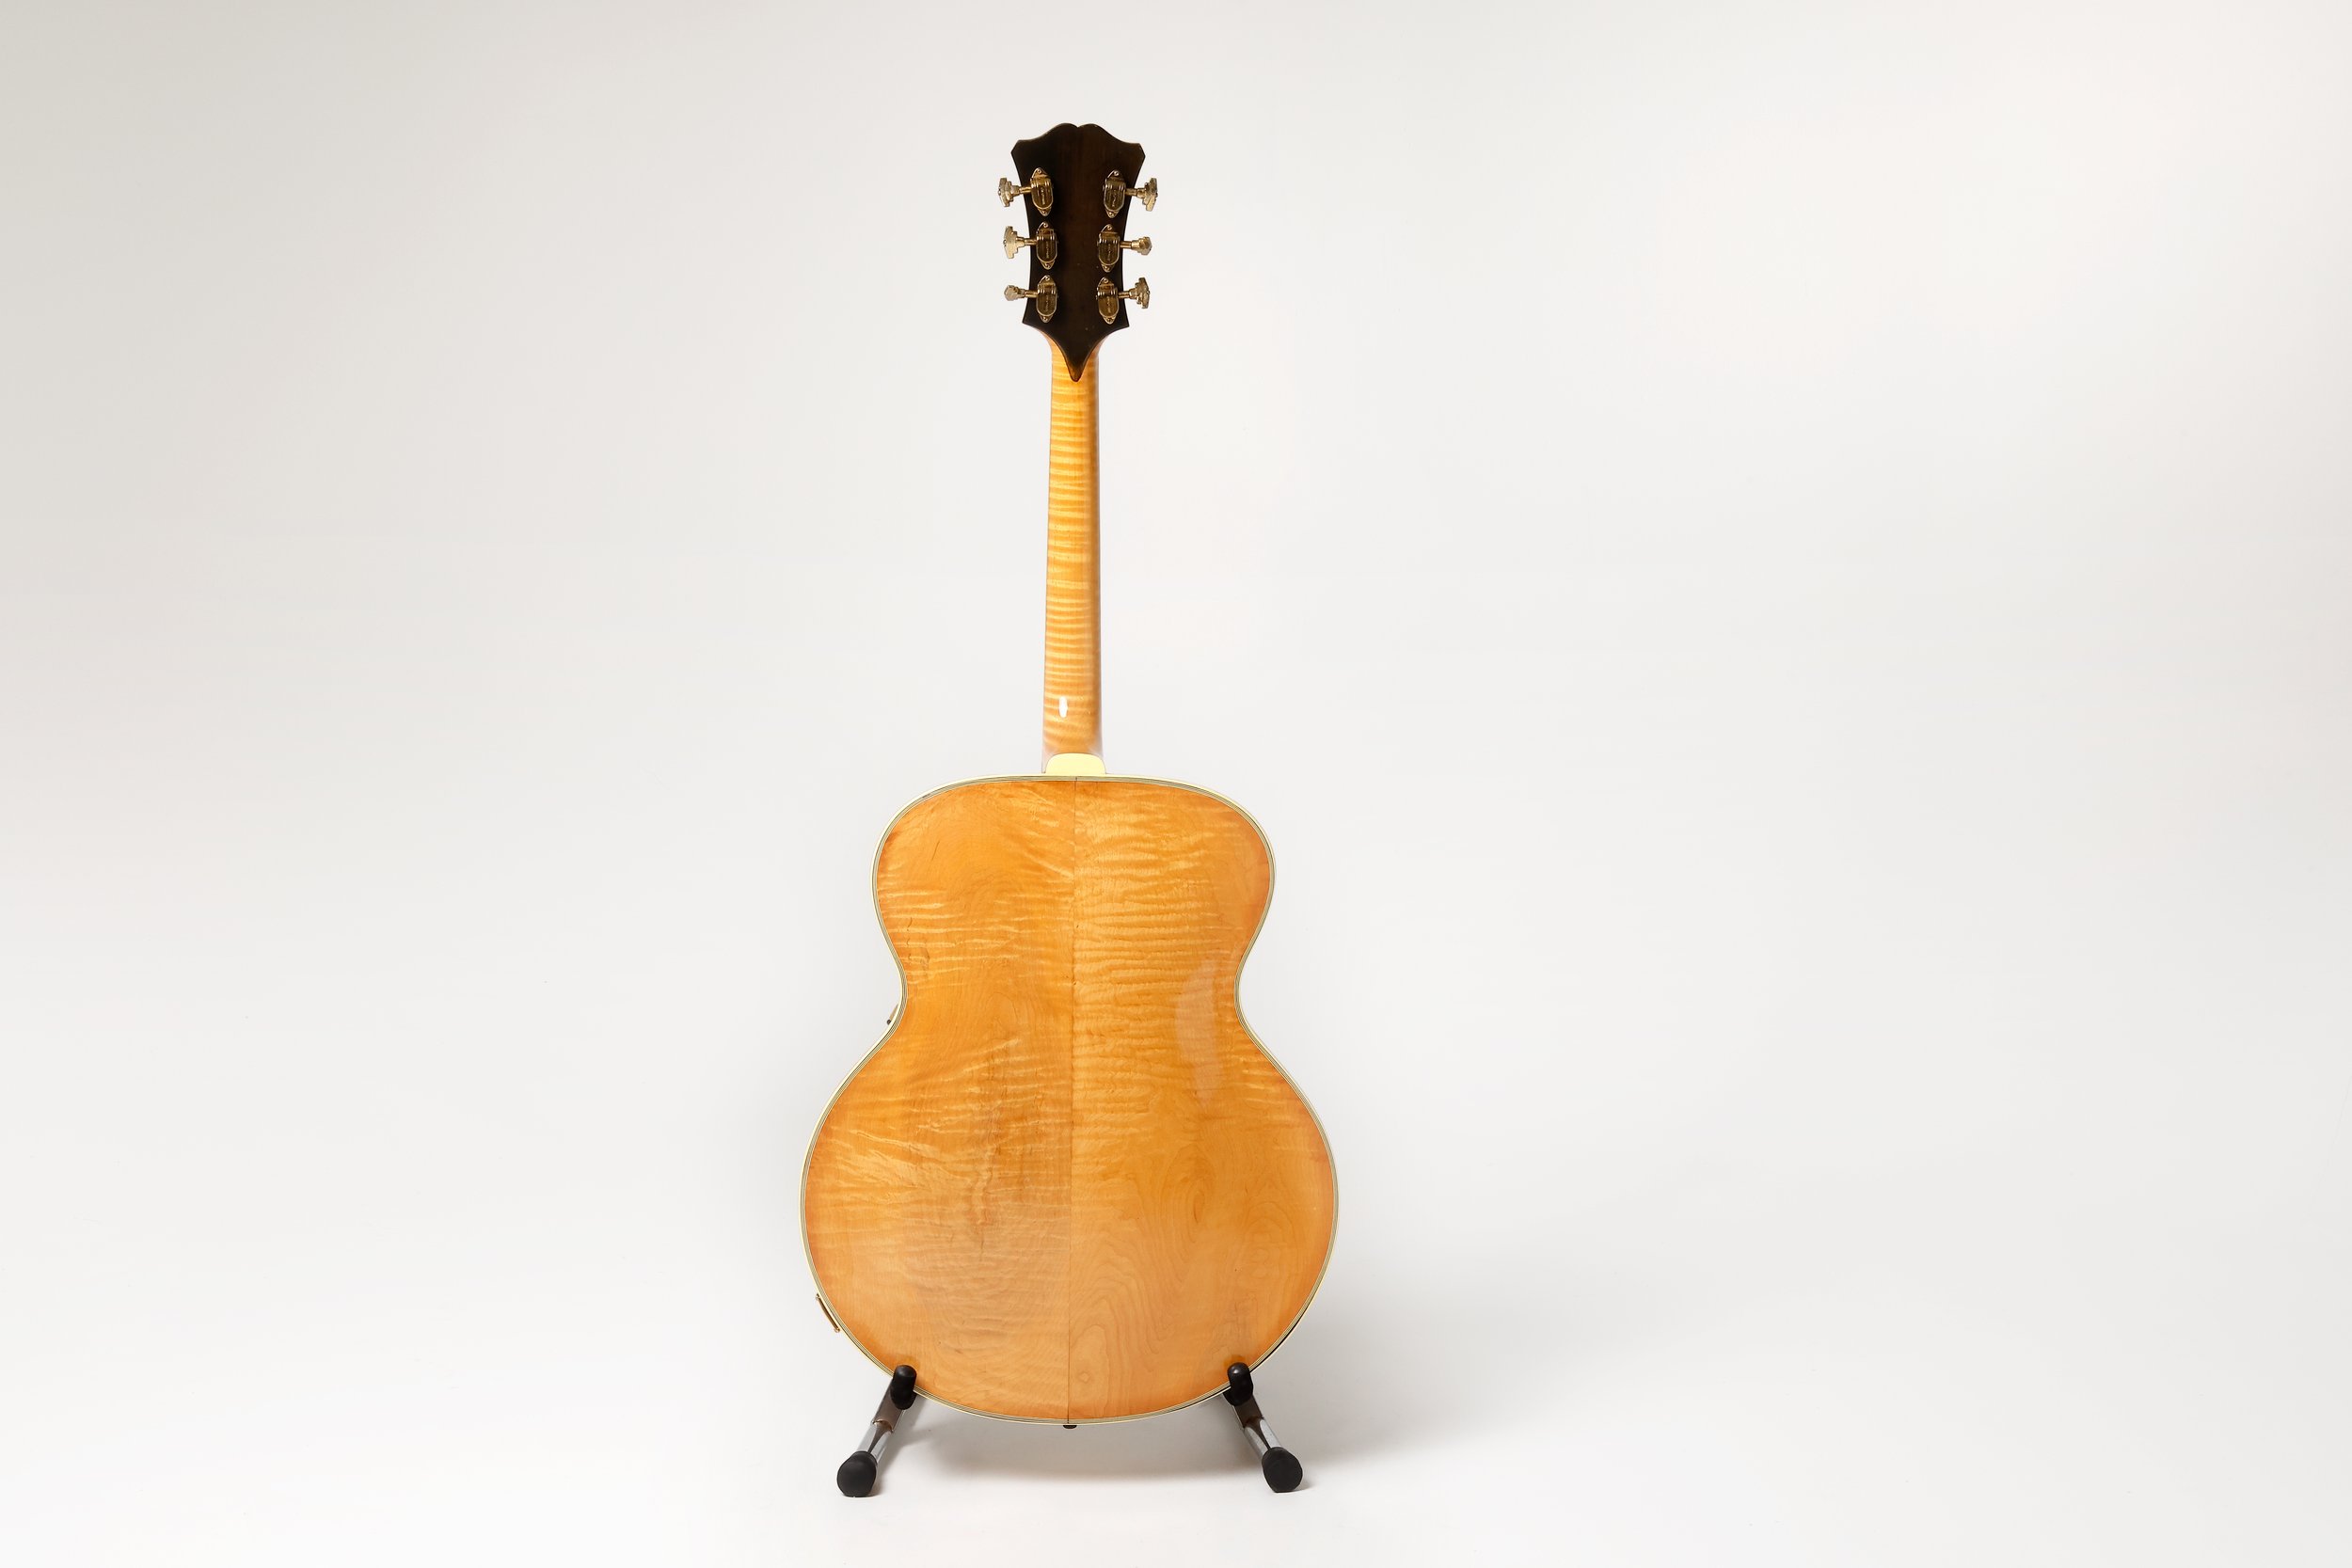
Flat Sawn Figured Maple Back and Sides
Quarter Sawn Maple Neck
17 ¾” Lower Bout
21 3/8” Body Length
3 1/16” Body Depth
X Bracing
6.35 Lbs
25” Scale Length
CT scan data and imagery courtesy of the Electric Guitar Innovation Lab.


MEASUREMENT
The tonal character of this 1955 D’Angelico New Yorker—like any acoustic instrument—is the result of its unique radiating modal signature.
The measurement techniques used to generate the following data were developed by the Violin Society of America’s Oberlin Acoustics Workshop.
For more on instrument acoustics, please visit Euphonics – The science of musical instruments
For more on archtop guitar acoustics, please see: Archtop Guitar Dynamics | Violin Society of America Papers (vsapapers.org); and Modal analysis of free archtop guitar top plates | The Journal of the Acoustical Society of America | AIP Publishing
Response Curve
The spectral plot is an FFT response curve of a near-field acoustic radiation measurement. A calibrated measurement microphone was placed directly in front of the instrument pointed at the center of the bridge. The microphone is one plate length away from the instrument and represents the approximate distance of the musician's ear relative to the bridge.
The peaks in amplitude occur at resonant frequencies defined by the instrument’s physical geometry and the material properties used for its construction. Each frequency corresponds to a vibrational modal pattern which propagates acoustic energy to the player and listener.
A calibrated impulse hammer taps the instrument normal to the top at the location of the low E string. The spectral plot shows a response up to 500 Hz, these are the signature modes of vibration.

Geometry
Polar Plot
The polar plot is a surround (360º) acoustic radiation measurement representing the bridge plane of the instrument. The decibel measurement was taken using a calibrated impulse hammer and measurement microphone. The microphone is located one plate length away from the instrument, the hammer taps the bridge and the response is recorded. The microphone is stationary and the instrument rotates 360 degrees with measurements taken at 24 equidistant points.
0º is the front of the instrument and positioned at the bottom of the graph. If this plot were printed on a piece of paper lying on a table top, then the front of the guitar would be vertical and facing the reader. The piece of paper represents the bridge plane.
Modal Analysis
The modal visualizations are actual measurements of the vibrational behavior of the guitar's top, back, neck, and tailpiece. The deeper the color, the greater the displacement representing a more active vibrating region at a specific resonant frequency. The figures shown are the strongest radiating modes and make up the majority of low frequency near-field acoustic output.
If this image were printed on a piece of paper, the teal area would be moving away from the reader and the orange area would be moving toward the reader in the opposite phase.
Modal analysis was performed using the techniques established by violin maker George Stoppani and the Oberlin Acoustics Workshop. About George Stoppani | www.stoppani.co.uk